Home
 About Madagascar
  Maps
  FAQs
  People
  History
  Environment
 Flora
 Wildlife
  Birds
  Fish
  Frogs
  Invertebrates
  Lemurs
  Mammals
  Reptiles
 Places
  Antananarivo
 Conservation
  ANGAP
  Parks
  Guides
  News
 Photos
 Educational
 Media resources
 Madagascar News
 Store
 Madagascar Travel
 About the site
 How to help
 Books
 Links
 Contact


Map showing human induced soil degradation and erosion in Madagascar

This map has been adapted from FAO AGL (The United Nations Food and Agricultural Organization's Land and Plant Nutrition Mangement Service) materials. All data is copyright © FAO AGL 2004.

FAO /AGL National Soil Degradation Maps:
Severity of Humaned Induced Soil Degradation in MADAGASCAR


SeverityMappedMappedPopulationPopulation %Population densityWastelandInfrequentCommonFrequentVery frequentDominantDegradedDegraded %
(km2)(km2)(km2)(km2)(km2)(km2)(km2)(km2)
Light4.627,0942,038,84413.575.25-677----6770.11
Moderate24.5145,1534,904,48832.433.79-553-22,143--22,6963.82
Severe48.2286,0076,613,66043.723.12---28,37631,31329,17388,86214.97
Very Severe21.9130,0811,478,6569.811.37----22,27549,82872,10312.14
Not Classified0.95,367109,1560.720.345,367-----00
TOTALS100593,70215,144,80410025.515,3671,230050,51953,58879,001184,33831.05


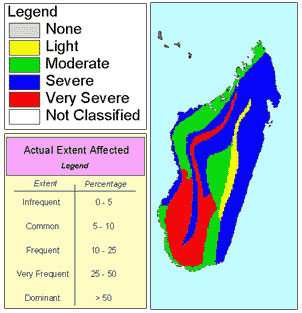
Madagascar MAPS Index.


The above image has been adapted from a NASA satellite photo. To learn more visit The Earth Observatory


home | photos index | search | about | contact

Unless otherwise noted, all content and images are the property of Rhett Butler, content copyright 2004-2006.
All rights reserved.